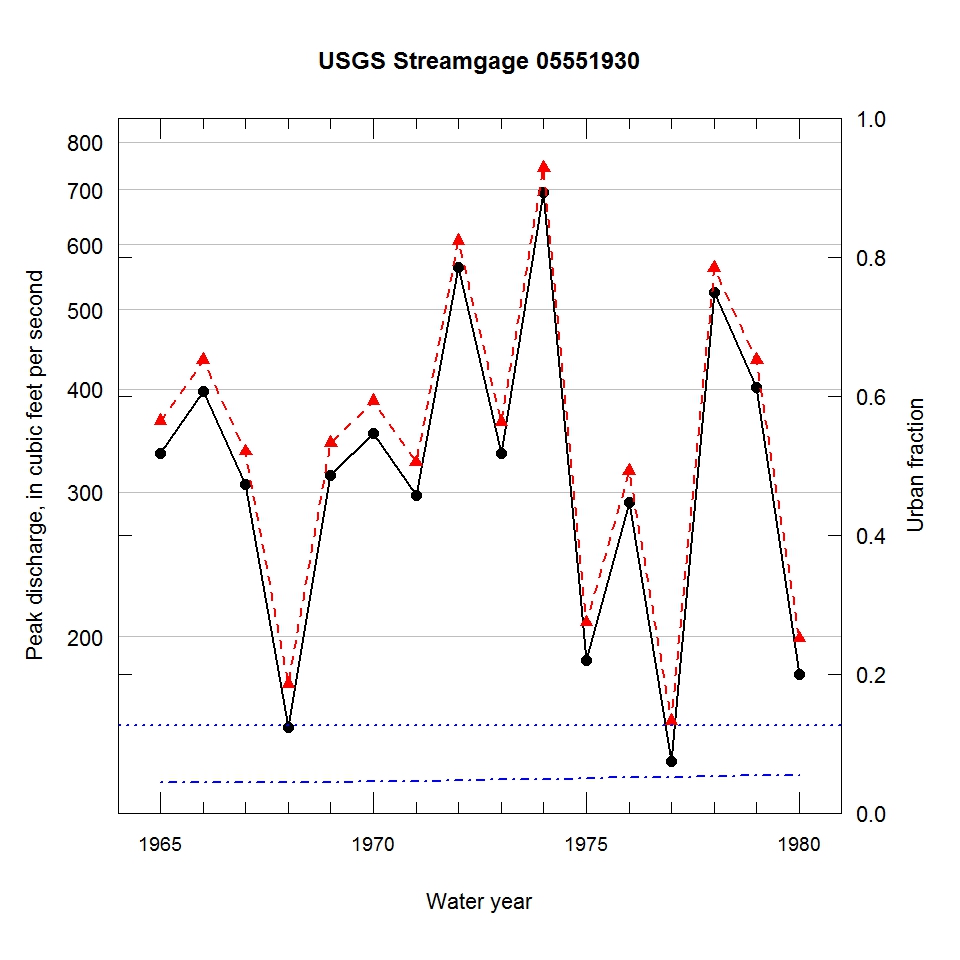
Observed and urbanization-adjusted annual maximum peak discharge and associated urban fraction and precipitation values at USGS streamgage:
05551930 WELCH CREEK NEAR BIG ROCK, IL


| Water year | Segment | Discharge code | Cumulative reservoir storage (acre-feet) | Urban fraction | Precipitation (inches) | Observed peak discharge (ft3/s) | Adjusted peak discharge (ft3/s) | Exceedance probability |
| 1965 | 1 | -- | 0 | 0.044 | 0.069 | 334 | 366 | 0.503 |
| 1966 | 1 | -- | 0 | 0.044 | 0.477 | 398 | 434 | 0.381 |
| 1967 | 1 | -- | 0 | 0.044 | 1.113 | 306 | 336 | 0.571 |
| 1968 | 1 | -- | 0 | 0.045 | 1.337 | 155 | 175 | 0.874 |
| 1969 | 1 | -- | 0 | 0.045 | 0.109 | 314 | 344 | 0.551 |
| 1970 | 1 | -- | 0 | 0.045 | 1.444 | 354 | 387 | 0.462 |
| 1971 | 1 | -- | 0 | 0.046 | 0.374 | 297 | 326 | 0.595 |
| 1972 | 1 | -- | 0 | 0.047 | 1.071 | 563 | 606 | 0.179 |
| 1973 | 1 | -- | 0 | 0.048 | 1.467 | 334 | 365 | 0.507 |
| 1974 | 1 | -- | 0 | 0.049 | 1.320 | 694 | 744 | 0.096 |
| 1975 | 1 | -- | 0 | 0.050 | 0.855 | 187 | 208 | 0.820 |
| 1976 | 1 | -- | 0 | 0.051 | 1.089 | 291 | 318 | 0.611 |
| 1977 | 1 | -- | 0 | 0.052 | 0.834 | 141 | 158 | 0.897 |
| 1978 | 1 | -- | 0 | 0.053 | 1.390 | 525 | 562 | 0.214 |
| 1979 | 1 | -- | 0 | 0.054 | 0.354 | 402 | 434 | 0.381 |
| 1980 | 1 | -- | 0 | 0.055 | 0.913 | 180 | 199 | 0.834 |

